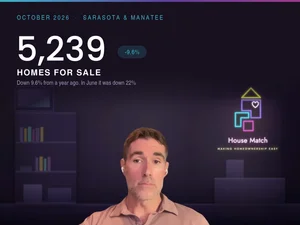
In June, Sarasota and Manatee counties had 22 percent fewer single-family homes for sale than a year earlier. At the end of September, that gap was 9.6 percent.
That is the story of this month's report. Inventory is still lower than a year ago, but the shortfall has narrowed three months running, because inventory fell less this summer than it did last summer. In September, new listings rose 7.6 percent and new pending sales fell 3.2 percent, the first year-over-year decline in pendings this year. Prices held: the median sale price was $485,000, the same as in August.
All figures below come from the Florida Realtors Monthly Market Detail for the North Port, Sarasota, and Bradenton MSA, released October 16, 2026, covering single-family homes.
September 2026 at a glance
| Metric | September 2026 | September 2025 | Change |
|---|---|---|---|
| Closed sales | 1,317 | 1,308 | +0.7% |
| Median sale price | $485,000 | $465,000 | +4.3% |
| Average sale price | $813,356 | $619,149 | +31.4% |
| Median time to contract | 51 days | 62 days | −17.7% |
| Median percent of original list received | 95.0% | 92.8% | +2.4% |
| Active inventory | 5,239 | 5,793 | −9.6% |
| Months supply of inventory | 3.8 | 4.5 | −15.6% |
| New listings | 1,544 | 1,435 | +7.6% |
Source: Florida Realtors, North Port-Sarasota-Bradenton MSA, single-family homes, September 2026.
The inventory gap narrowed again
Active inventory ended September at 5,239 homes, down 9.6 percent from 5,793 a year ago and almost unchanged from August's 5,235. The year-over-year decline was 22.0 percent in June, 16.4 percent in July, and 14.5 percent in August.
There were still fewer homes for sale than a year ago, but the gap closed a little more each month from June to September.
In September, two things moved. New listings rose 7.6 percent to 1,544, also up from 1,497 in August. And new pending sales, the homes that went under contract during the month, fell 3.2 percent to 1,178. Every month from January through August had more new pendings than the same month a year earlier.
Compared with August's 1,330, pendings fell 11.4 percent. Some of that is seasonal: last year pendings also fell from August to September, from about 1,295 to 1,217. That is why the year-over-year figure is the better read. Because most contracts take a month or two to close, pending sales are the closest thing in this report to an early look at closings, though not every pending sale closes.
Closed sales were essentially flat: 1,317 against 1,308 last September, up 0.7 percent, and 1,333 in August. Year to date, closed sales are up 6.5 percent at 12,784.
The median sale price rose 4.3 percent to $485,000. Last September the median had fallen 3.2 percent from the year before, so this gain puts it only about 1 percent above September 2024. The year-to-date median, also $485,000, is up 2.1 percent, and that is the steadier read.
The average sale price jumped 31.4 percent to $813,356. That does not mean typical homes got 31 percent more expensive. Eleven homes sold for $5,000,000 or more in September, against none a year ago, and an average moves with a handful of very large sales. The median, which does not, rose 4.3 percent.
Supply is still on the seller's side
Florida Realtors treats 5.5 months of supply as the balance point between a buyer's market and a seller's market. Above it favors buyers, below it favors sellers.
Months supply was 3.8 in September, the same as in August and down from 4.5 a year ago.
Part of the year-over-year inventory decline is a base effect. Last September's inventory was up 9.3 percent from the year before, so this year is measured against a high number. On the report's own figures, September's inventory is about 1 percent below September 2024's.
Pending inventory, meaning homes under contract but not yet closed, stood at 1,642, up 1.4 percent from a year ago.
What sellers should take from this
Homes went under contract faster than a year earlier, with a caveat. Median time to contract fell from 62 days to 51, and median time to sale fell from 107 days to 96. But last September, homes were slow to go under contract: time to contract a year ago was up 31.9 percent on September 2024. The year-to-date figure, 50 days, down 10.7 percent, is the steadier read. September was also slower than August, when the median was 46 days.
Pricing discipline still decides the outcome. The median seller received 95.0 percent of their original list price, up from 92.8 percent a year ago. The typical home still sold about five percent below where it was first listed. That is a ratio of sale price to original list price, not what a seller nets after costs. New listings are up from a year ago while new pendings slipped, so sellers were competing with more fresh listings for slightly fewer new contracts than last September. In our experience, an overpriced home sits and ends up negotiating anyway.
Your price band matters more than the market average. Homes between $500,000 and $599,999 went under contract in a median of 42 days, and $800,000 to $899,999 in 43, while $900,000 to $999,999 and $1,000,000 and above took 68. Among the ten main price ranges, closed sales grew fastest between $900,000 and $999,999, up 81.8 percent, though on only 40 sales. The $300,000 to $399,999 band was the busiest at 325 sales, down 4.4 percent.
| Price range | Closed sales | Change | Median days to contract |
|---|---|---|---|
| Under $200,000 | 24 | −4.0% | 9 |
| $200,000 to $299,999 | 101 | −11.4% | 47 |
| $300,000 to $399,999 | 325 | −4.4% | 48 |
| $400,000 to $499,999 | 243 | −2.8% | 52 |
| $500,000 to $599,999 | 174 | +11.5% | 42 |
| $600,000 to $699,999 | 116 | +1.8% | 50 |
| $700,000 to $799,999 | 80 | +2.6% | 63 |
| $800,000 to $899,999 | 49 | −15.5% | 43 |
| $900,000 to $999,999 | 40 | +81.8% | 68 |
| $1,000,000 and above | 165 | +9.3% | 68 |
Source: Florida Realtors, North Port-Sarasota-Bradenton MSA, single-family homes, September 2026.
What buyers should take from this
In our view, buyer leverage in this market still depends largely on price range. The table below shows how far active inventory moved in each band over the past year.
| Price range | Active listings | Change | |
|---|---|---|---|
| Under $200,000 | 45 | −16.7% | |
| $200,000 to $299,999 | 309 | −1.6% | |
| $300,000 to $399,999 | 1,133 | −1.6% | |
| $400,000 to $499,999 | 980 | −7.0% | |
| $500,000 to $599,999 | 588 | −19.5% | |
| $600,000 to $699,999 | 411 | −23.5% | |
| $700,000 to $799,999 | 329 | −19.8% | |
| $800,000 to $899,999 | 216 | −4.4% | |
| $900,000 to $999,999 | 169 | −5.6% | |
| $1,000,000 and above | 1,059 | −6.9% |
Source: Florida Realtors, North Port-Sarasota-Bradenton MSA, single-family homes, September 2026. Highlighted rows are the three bands with the steepest year-over-year declines among the ten main price ranges.
Among the ten main price ranges, selection fell the most in the middle of the market. Between $500,000 and $800,000 there were 1,328 active listings at the end of September, against about 1,680 a year ago, roughly a fifth fewer.
From $200,000 to $400,000, inventory barely moved, down 1.6 percent in each band. Homes priced under $500,000 make up almost half of everything for sale: 2,467 of 5,239 listings. The $300,000 to $399,999 range carried the largest count of any band, at 1,133. Under $200,000, inventory fell 16.7 percent, though that band holds only 45 listings.
On price, buyers have a little less room than a year ago: sellers received a median 95.0 percent of original list price, against 92.8 percent last September.
One more factor to plan around: 467 of September's closings were cash purchases, or 35.5 percent of all sales, close to the 35.1 percent of a year ago. If you are financing, expect to compete against cash on well-priced listings, and have your financing lined up before you start shopping.
Luxury closings rose, and the very top moved the average
At $1,000,000 or more, 165 homes closed in September, up 9.3 percent from about 151 a year ago. Median time to contract for the tier was 68 days, up 3.0 percent, against 51 days for the market as a whole.
| Price range | Closed sales | Median days to contract | Active listings |
|---|---|---|---|
| $1,000,000 to $1,249,999 | 33 | 80 | 207 |
| $1,250,000 to $1,499,999 | 40 | 53 | 176 |
| $1,500,000 to $1,999,999 | 37 | 52 | 183 |
| $2,000,000 to $2,999,999 | 25 | 78 | 192 |
| $3,000,000 to $4,999,999 | 19 | 82 | 179 |
| $5,000,000 to $9,999,999 | 5 | 190 | 92 |
| $10,000,000 and above | 6 | 130 | 30 |
Source: Florida Realtors, North Port-Sarasota-Bradenton MSA, single-family homes, September 2026.
The top two tiers helped drive September's jump in the average sale price: 11 sales at $5,000,000 or more, against none last September. Those homes also took the longest to go under contract, a median of 190 and 130 days, on very small counts.
Lower in the tier, closings between $1,250,000 and $1,499,999 rose 60.0 percent to 40, while $1,000,000 to $1,249,999 fell 43.1 percent to 33. Counts this small swing from month to month, so one month is not a trend.
New luxury listings rose 25.8 percent to 263, the second-largest increase among the ten main price ranges, after $900,000 to $999,999, up 43.2 percent. Luxury inventory fell 6.9 percent to 1,059, with the largest drop between $1,500,000 and $1,999,999, down 23.4 percent. Above $3,000,000, inventory rose 6.5 percent from $3M to $5M and 2.2 percent from $5M to $10M, and fell 6.3 percent above $10M.
Relative to sales, listings were more plentiful in this tier: 1,059 active listings against 165 September closings is about 6 to 1, compared with about 4 to 1 for all single-family homes. That is a rough one-month ratio, since inventory is counted by list price and closings by sale price, and it is not the report's months-of-supply figure.
Distressed sales
Last month we called foreclosures a number to watch. Foreclosure and REO sales rose to 19 in September from 7 a year ago, and short sales to 5 from 1. Together that is 24 of 1,317 closings, about 1.8 percent, up from 8 of 1,308, about 0.6 percent, last September. Traditional sales made up the other 1,293, at a median price of $485,000.
That is a jump from a small base. It is one month of data, not a trend, and distressed sales are still under 2 percent of the market.
What this means if you are making a move
Every neighborhood in Sarasota and Manatee moves differently than the metro numbers, and as the tables above show, so does every price band. If you want to know what your home is worth in today's market, or what your buying power looks like in the range you are shopping, we will walk you through it with the actual data for your address.
All data from Florida Realtors Monthly Market Detail, North Port-Sarasota-Bradenton MSA, single-family homes, September 2026, released October 16, 2026. Market data reflects past activity and is not a prediction of future results. Equal Housing Opportunity. Licensed real estate brokerage in the State of Florida.